Parameters
Default Parameters
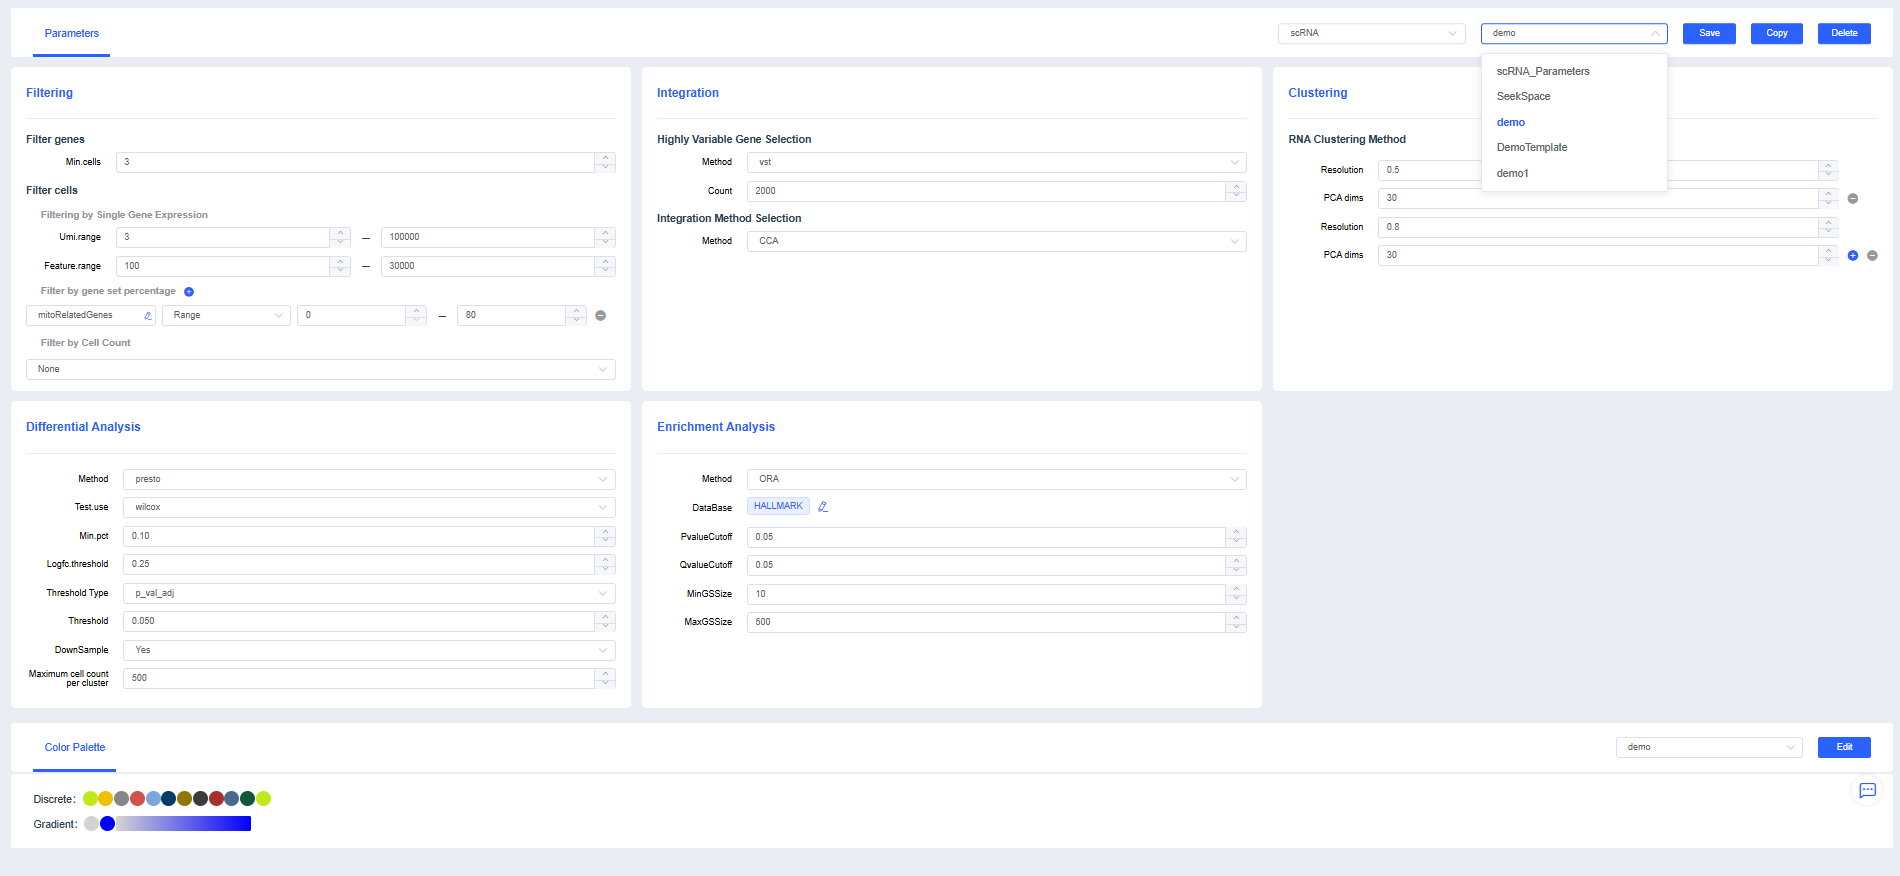
SeekSoulOnline provides a default template that contains all analysis-related parameters and color settings across six sections (Filtering, Integration, Clustering, Differential Analysis, Enrichment Analysis, and Color Palette). This template cannot be modified.
NOTE
The default Parameters are the platform-recommended configuration. We recommend copying the template and adjusting it based on actual needs.
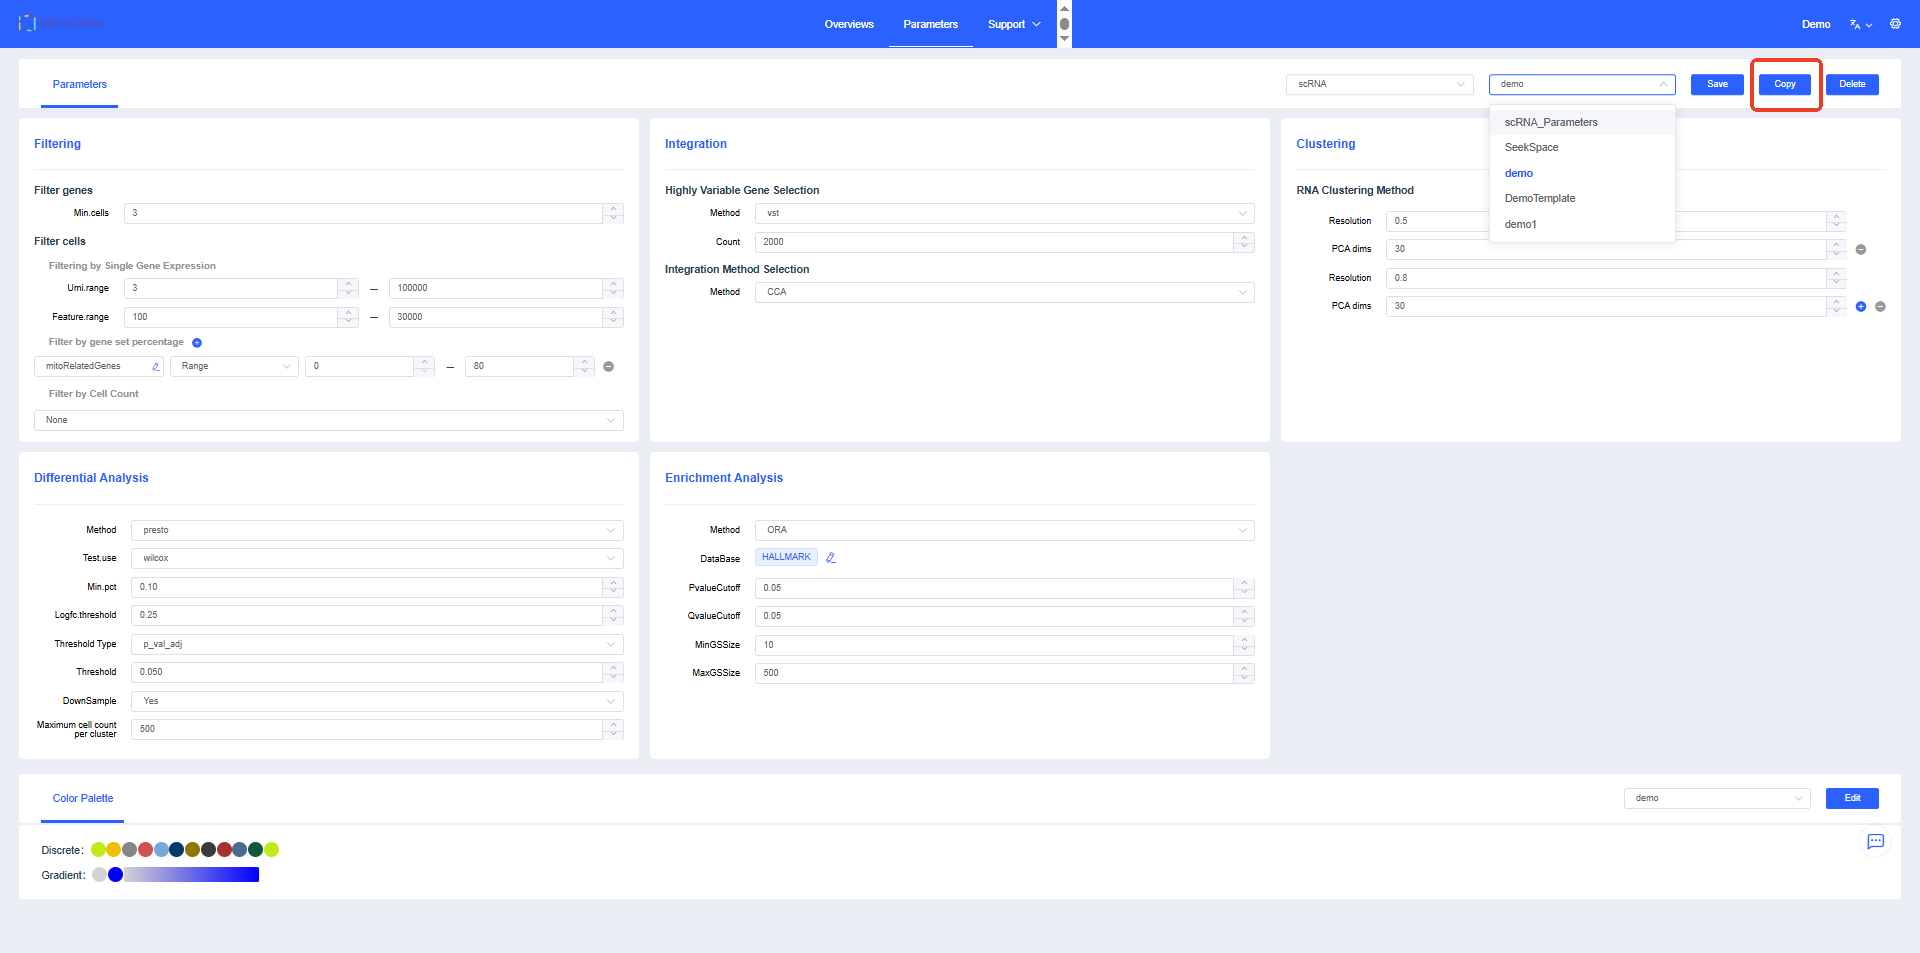
Copy Parameters
If you need to modify the template, click the Copy button in the upper-right corner of the page, set the template name, and adjust the parameters as needed.
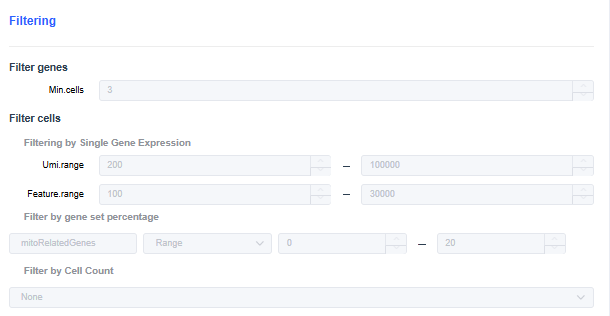
Filtering Parameters
scRNA
- Min.cells: Set the minimum number of cells in which each gene must be expressed. Genes below the threshold are filtered out.
- Umi.range: Set the UMI count range threshold per cell. Cells with UMI counts outside the range are filtered out.
- Feature.range: Set the range for the number of genes expressed per cell. Cells whose expressed gene counts fall outside the range are filtered out.
- Filter by gene set percentage:
- a. Gene set settings: Click 🖌 to add or increase gene sets from "My Gene Sets" for filtering. The mitochondrial gene set is selected by default. Click [+] to add new gene sets for filtering.
- b. Filtering method:
- MAD: Calculate the threshold based on the overall gene set expression ratio per cell and filter out cells whose gene set proportion exceeds the threshold.
- Range: Filter out cells whose mitochondrial gene proportion falls outside the specified interval according to the set maximum and minimum values.
- Filter by sample cell count: In multi-sample analyses, the number of cells detected per sample may vary greatly. You can use cell subsampling to keep the number of cells per sample at the same level.
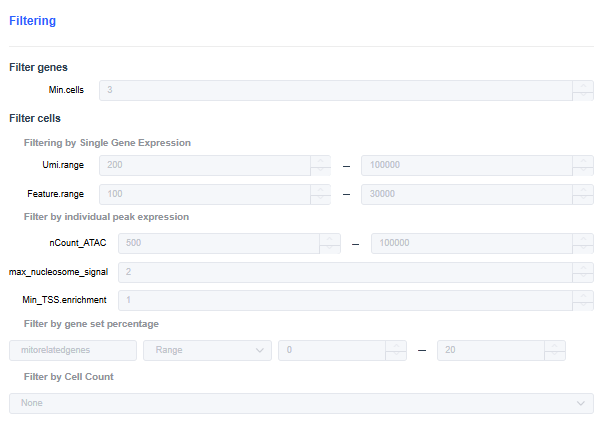
scRNA+scATAC
- Min.cells: Set the minimum number of cells in which each gene must be expressed. Genes below the threshold are filtered out.
- Umi.range: Set the UMI count range threshold per cell. Cells with UMI counts outside the range are filtered out.
- Feature.range: Set the range for the number of genes expressed per cell. Cells whose expressed gene counts fall outside the range are filtered out.
- nCount_ATAC: Total number of ATAC transposase events detected per cell.
- max_nucleosome_signal: Nucleosome signal per cell; filter out cells with poor chromatin status (e.g., excessive nucleosome degradation, cell death).
Filter out cells with values greater than 2.
- Min_TSS.enrichment: TSS enrichment score per cell; filter out cells with poor chromatin status (e.g., dead cells).
Filter out cells with TSS < 2.
- Filter by gene set percentage:
- a. Gene set settings: Click 🖌 to add or increase gene sets from "My Gene Sets" for filtering. The mitochondrial gene set is selected by default. Click [+] to add new gene sets for filtering.
- b. Filtering method:
- MAD: Calculate the threshold based on the overall gene set expression ratio per cell and filter out cells whose gene set proportion exceeds the threshold.
- range: Filter out cells whose mitochondrial gene proportion falls outside the specified interval according to the set maximum and minimum values.
- Filter by Cell Count: In multi-sample analyses, the number of cells detected per sample may vary greatly. You can use cell subsampling to keep the number of cells per sample at the same level.
Integration Parameters
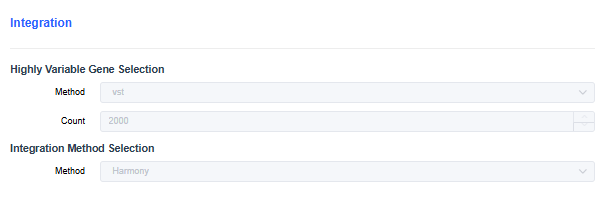
scRNA
- Highly Variable Gene Selection: Choose the method for finding highly variable genes during dimensionality reduction. The vst method is commonly used.
- Count of highly variable genes: Set the number of highly variable genes/bins.
- Integration Method Selection: For multi-sample integration, use the merge method when batch effects are minor. When batch effects are large, use Harmony (default), CCA, or RPCA to remove them.
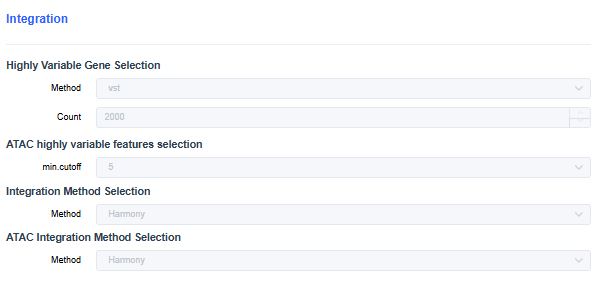
scRNA+scATAC
- Highly Variable Gene Selection: Choose the method for finding highly variable genes during dimensionality reduction. The vst method is commonly used.
- Count of Highly Variable Gene Selection: Set the number of highly variable genes/bins.
- ATAC highly variable features selection: Threshold used to filter low-accessibility peaks when calculating variable peaks. For example, min.cutoff=5 means only peaks open in at least five cells are included.
- Integration Method Selection: Same as scRNA; use Harmony/CCA/RPCA when batch effects are large.
- ATAC Integration Method Selection: Automatically filled based on the RNA integration method. ATAC and RNA perform batch correction and integration independently.
After multi-sample integration, there is still one ATAC assay and RNA assays. (If CCA/RPCA is used, there will also be an integrated assay that stores the RNA expression matrix after correction.)
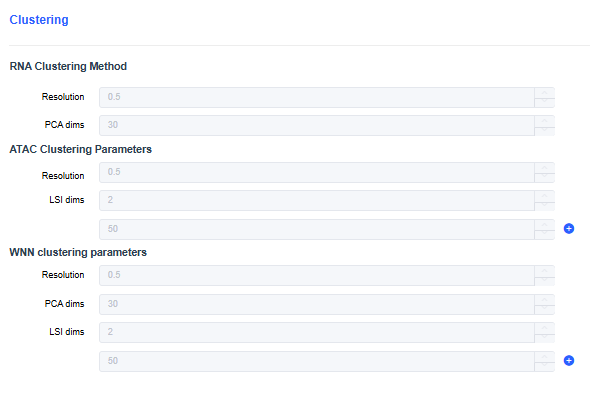
Clustering Parameters
scRNA
- Resolution: Set the resolution for clustering cells (default 0.5). Increasing the resolution yields more clusters.
- PCA dims: Set the number of dimensions used for clustering based on the elbow point of the PCA curve (default 30). Typically between 10 and 30; use more dimensions for larger cell counts.
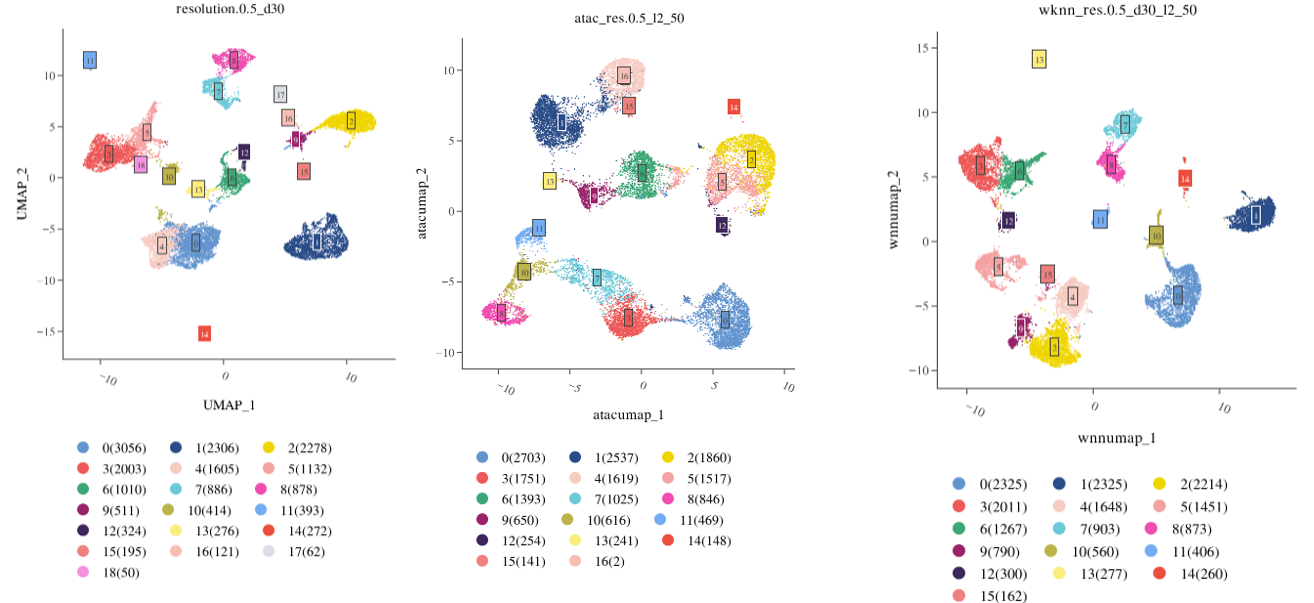
scRNA+scATAC
- ATAC clustering parameters: Perform clustering based on ATAC accessibility using LSI dimensionality reduction, considering only ATAC heterogeneity.
- WNN clustering parameters: Perform clustering by combining PCA and LSI to account for both ATAC and RNA heterogeneity.
Based on Seurat's Signac tool, the default LSI dimensions are dims = 2:50. Too few dimensions may lose important biological variation, while too many may lead to over-clustering.
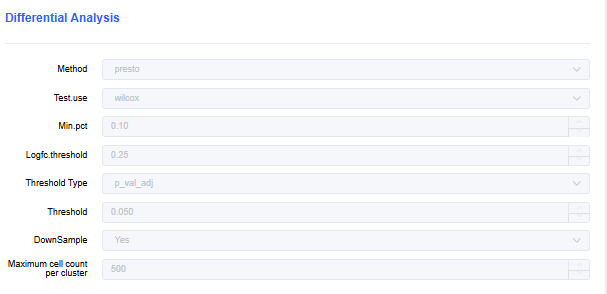
Differential Analysis Parameters
- Method: presto or findmarker.
- Test.use: Choose the method for identifying differentially expressed genes. The default is wilcox.
- Min.pct: Set the minimum cell proportion in which a gene must be expressed (default 0.1). Genes below the threshold are excluded from the differential gene list.
- Logfc.threshold: Set the minimum absolute value for up- or down-regulated fold change (average log2 fold change, default 0.25).
- Threshold Type: Set the threshold for determining significant differential expression between clusters. Default Padj < 0.05.
- DownSample: Whether to perform cell subsampling (default Yes).
- Maximum cell count per cluster: Set the maximum number of cells per cluster when subsampling.
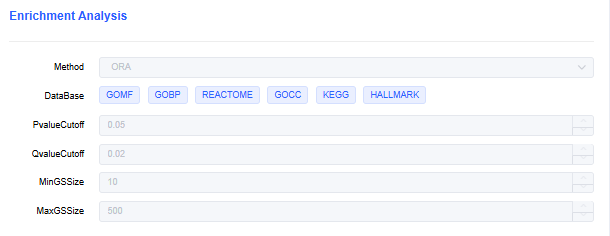
Enrichment Analysis Parameters
- Method: Over-Representation Analysis (ORA) or Gene Set Enrichment Analysis (GSEA).
- Database: Choose the database for enrichment analysis. Click 🖌 to add or increase gene sets from "My Databases".
- PvalueCutoff: Set the p-value threshold for enrichment results. Results above the threshold are filtered out.
- QvalueCutoff: Set the q-value threshold for enrichment results. Results above the threshold are filtered out.
- MinGSSize: Set the minimum number of genes in a gene set. Results below the threshold are filtered out.
- MaxGSSize: Set the maximum number of genes in a gene set. Results above the threshold are filtered out.
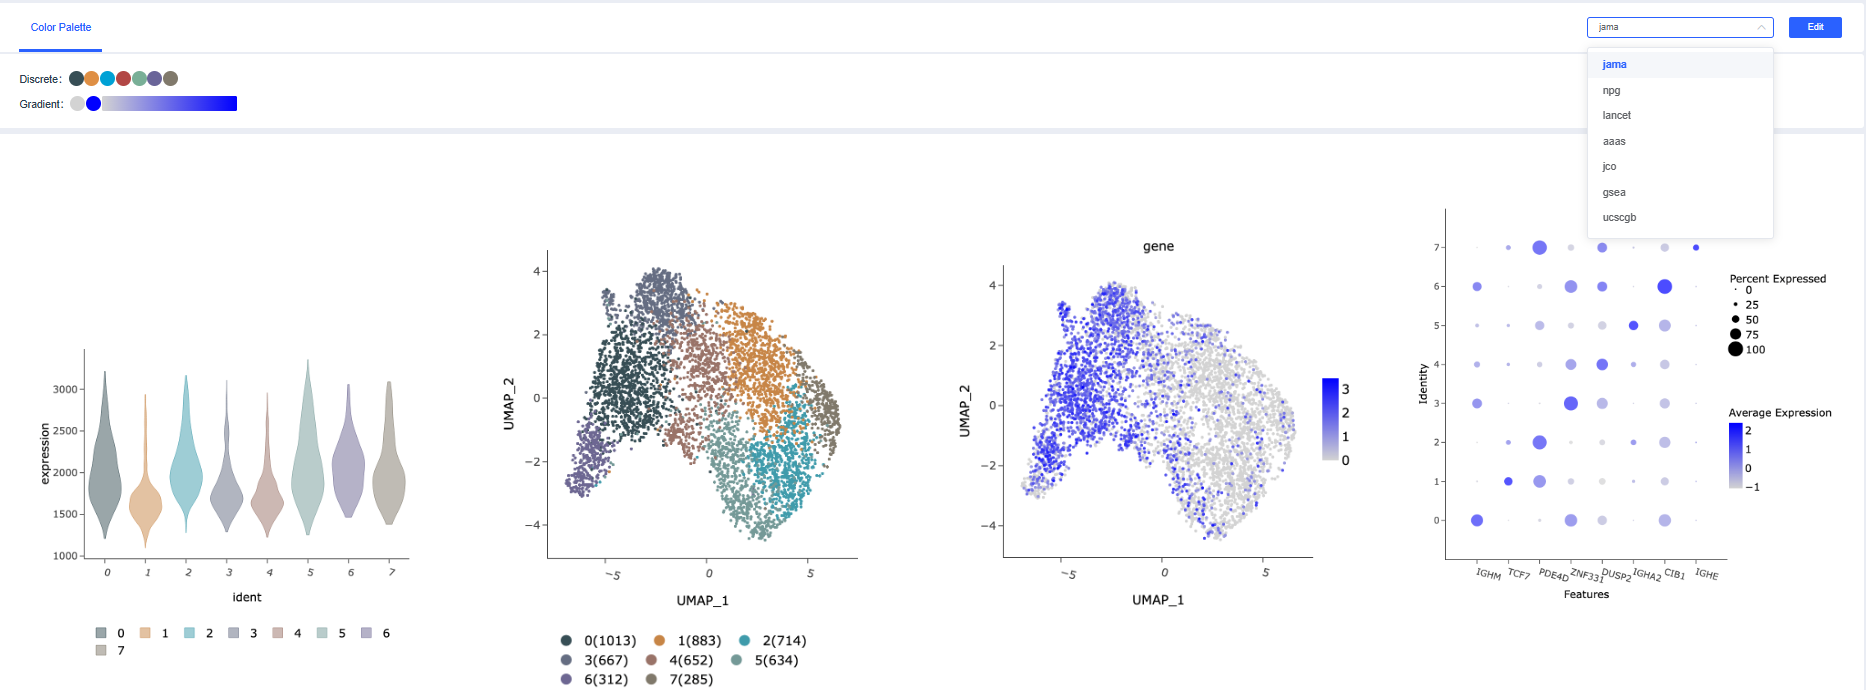
Color Palette
Choose a color scheme: In the Color Scheme section, select the required palette in the upper-right corner. Discrete colors are used for categorical/grouped plots, and gradient colors are used for continuous-value plots. The preview area below shows the examples.
Customize a color scheme:
a. Create a new color scheme: Click the New button to the right of "Color Scheme Preview" to open the color editing window. Click a color scheme name to display its color settings; only one scheme can be expanded at a time. Click [➤] to create a new palette, enter a unique scheme name, and edit the colors. Click [Reset] to clear the discrete colors.
- Add colors: Select a color in the palette and click [+] to add it to the discrete palette.
- Delete colors: Click a discrete color to highlight it, then click [-] to delete it.
- Modify colors: After selecting a color swatch, click other colors in the palette to change it. Both discrete and gradient palettes are supported.
- Click [Add] to create the color scheme.
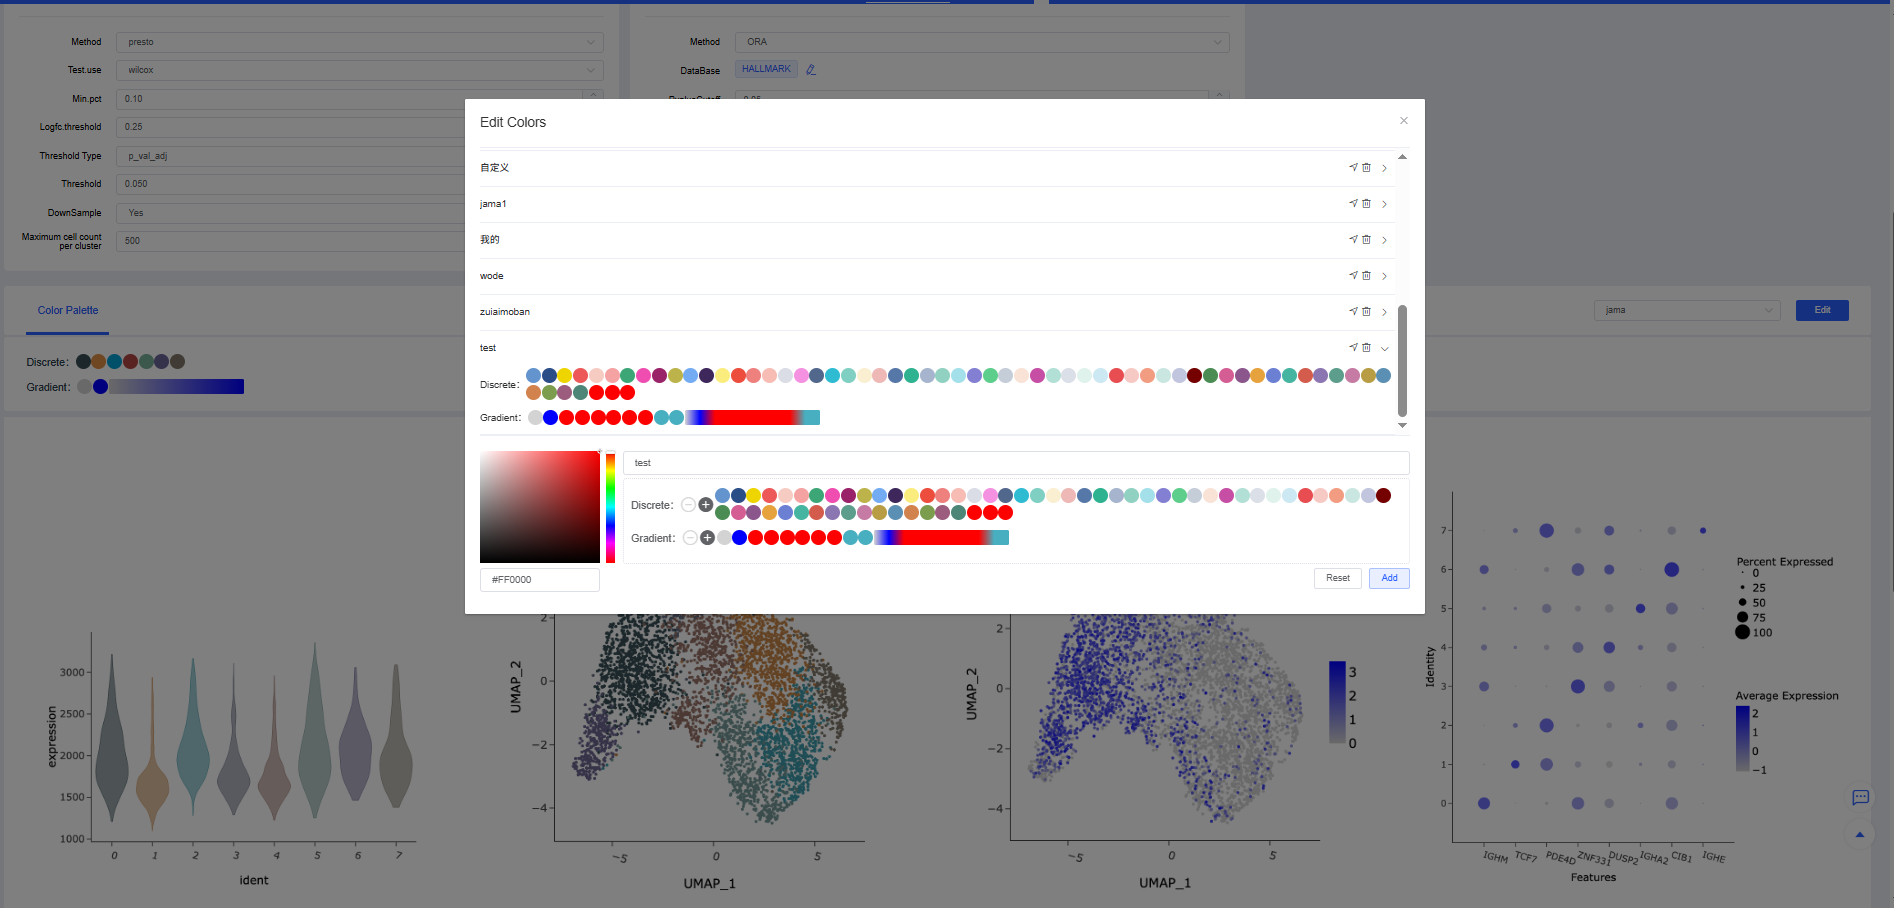
b. Delete a color scheme: Custom color schemes can be deleted by clicking [Delete] next to the scheme in the list.
Save and delete templates: Click [Save] in the upper-right corner of the Parameters page to save changes, or click [Delete] to remove unused templates.
